
Growing a new ABA practice means keeping an eye on the numbers. By regularly tracking key performance metrics, owners and clinicians get a clear picture of how well their programs and operations are working.
Data helps you spot problems early, make smarter decisions, and improve both client care and business health. In this article, you will learn some essential key metrics every new ABA practice should track.
1. Client Progress and Outcomes
Measuring how clients improve is at the heart of ABA care. You can track skill acquisition and behavior goals by using standardized tools and visual charts.
For example, many practices count the percentage of treatment goals mastered each quarter or improvements on assessments.
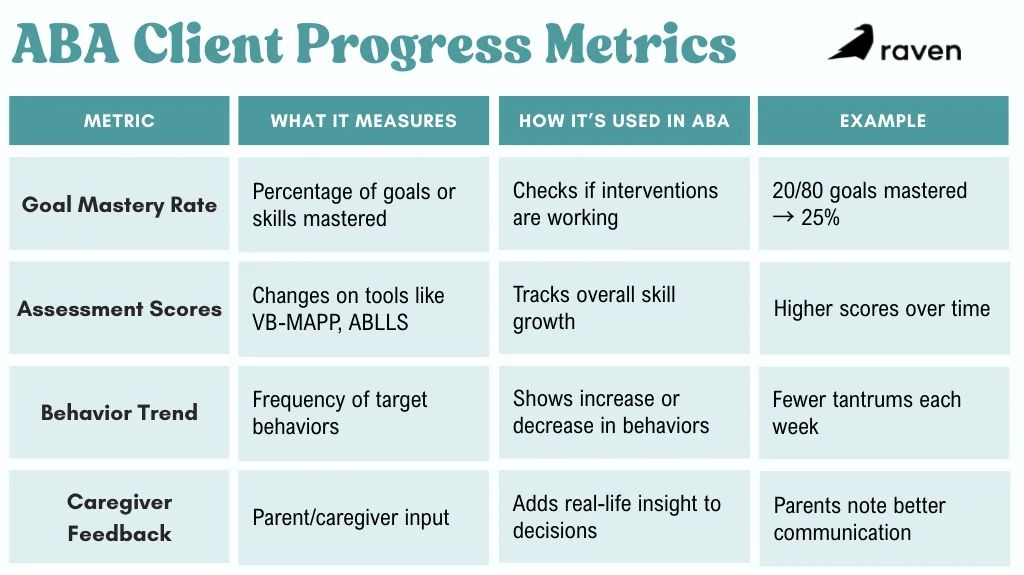
If a child masters 20 out of 80 goals in three months, their progress rate is 25%. Trends like this show whether current strategies are working.
- Goal mastery rate is the percentage of behavioral goals or skills achieved over time.
- Assessment scores such as the changes on tools like the VB-MAPP or ABLLS assessments.
- Behavior trend is the count/frequency of target behaviors (e.g. tantrums) versus time.
- Caregiver feedback includes parent surveys on the child’s improvements and engagement.
These figures make growth concrete. For instance, if data show only 50% of goals are met, supervisors might adjust interventions or increase therapy hours.
Consistent tracking allows therapists to systematically assess progress and tweak plans as needed. This ensures each child’s program is truly effective and evidence-based.
2. Session Attendance and Retention
The best therapy plans only work if clients actually attend. Attendance rate (the percent of scheduled sessions that occur) is a must-watch metric. High attendance ensures consistency; missed appointments slow progress and shrink revenue.
- No-show/cancellation rate to track how many sessions are missed each month (e.g. 5 no-shows out of 100 sessions = 5%). Aim to keep this low (often under 5–10%).
- Turnover rate is the percentage of clients who end therapy early. Understanding why families leave (dissatisfaction, insurance, etc.) highlights service gaps.
- Referral and retention to monitor how many new leads convert to ongoing clients and how many complete recommended programs.
Improving attendance often involves reminders and flexibility. Setting up phone/text reminders or online scheduling can bump rates higher. By watching this metric weekly, you can quickly spot if one client or program needs outreach or if systemic issues (like scheduling conflicts) are causing gaps.
3. Staff Productivity and Utilization
A practice’s therapists are its greatest resource. Tracking how they’re used is crucial. Staff utilization rate measures the portion of employee hours spent in billable therapy versus non-billable time.
If a full-time RBT works 40 hours a week but only delivers 28 hours of client sessions, the utilization rate is 70%.
- Billable hours percentage is the total therapy hours delivered ÷ total available hours × 100.
- Sessions per therapist is the average number of sessions each therapist completes weekly.
- Case load is the number of active clients per BCBA or RBT.
- Overtime or idle time track extra hours or gaps in schedules.
Another approach is to measure session completion rate per staff member. For example, if a therapist is scheduled for 20 sessions in a week but completes only 18, that’s a 90% completion rate.
Monitoring these numbers helps managers balance workloads. If utilization is only 60%, you might hire more clients or cross-train staff. If it’s 95% (almost no breaks), you should hire or reassign tasks to prevent burnout.
4. Billing Accuracy and Financial Metrics
Money matters as much as therapy details. Accurate billing keeps your clinic financially healthy. Track the following finance-related metrics:
- Claim approval rate, which is the percentage of insurance claims paid on first submission.
- Average reimbursement time tracks the days between service date and insurer payment. Shorter is better. Long lag times can signal administrative bottlenecks.
- Claim denial rate is the portion of claims rejected. Every denied claim needs rework. Keeping this low (e.g., below 5–10%) is vital.
- Gross collection rate is the collected revenue ÷ billed charges × 100.
- Days in Accounts Receivable (AR) tracks how long it takes on average to collect an outstanding invoice. Fewer days means healthier cash flow (industry targets are often under 45 days).
By watching billing data, you can find errors early. For instance, if denial rates spike, it may mean documentation issues or coding mistakes.
Likewise, tracking the number of sessions billed versus delivered (the hours delivered vs. authorized KPI) ensures you aren’t leaving money on the table.
Finally, revenue per session is a useful gauge. Divide total revenue by total sessions to see how much each session brings in on average. If this number falls, it could hint at lower reimbursement rates or excessive discounts. Adjusting pricing or payer mix may be needed.
Conclusion
Collecting all these metrics does more than fill a spreadsheet; it drives better care and growth. Consistent tracking helps you spot trends and make informed choices. For example, if weekly data show one client’s progress slipping, you can intervene faster (add hours or adjust techniques). If staff utilization drops unexpectedly, you might investigate scheduling problems before revenue dips.
Using performance insights also ensures compliance and quality. Tracking metrics like authorization renewals and treatment duration keeps the practice aligned with insurance rules.
In short, a dashboard of ABA metrics empowers owners and clinicians to ask the right questions (“Why did attendance drop 10% this month?”) and test solutions. Over time, this feedback loop boosts both the quality of care and operational growth.