Precision Teaching is a system for defining, measuring, and analyzing behavior. It is a way of watching how a learner interacts with a task and make immediate adjustments based on what the data says.
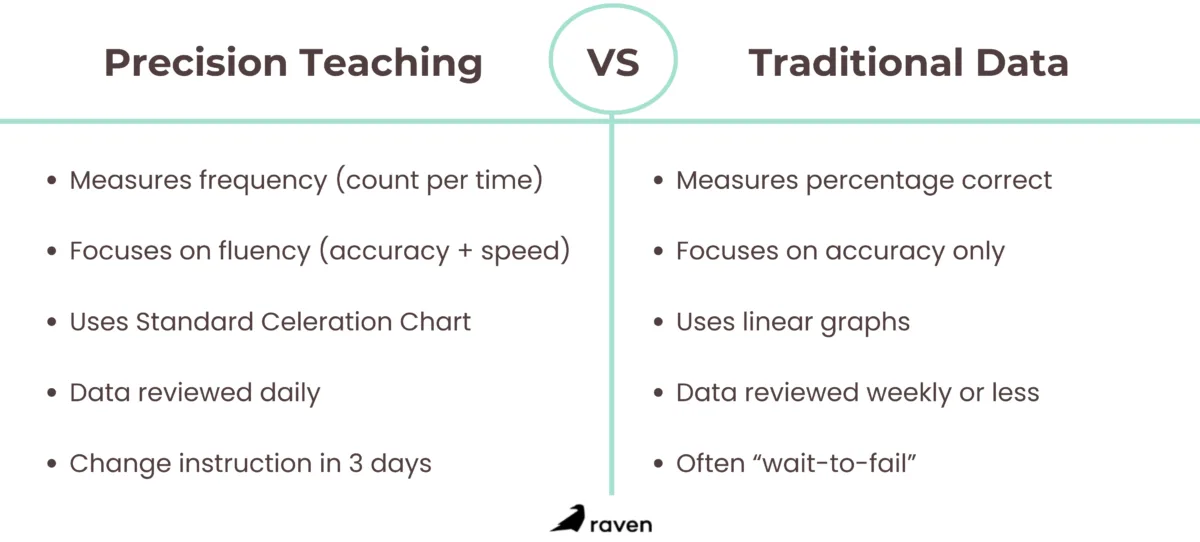
The characteristic feature of Precision Teaching is its reliance on Frequency i.e., count per time. In traditional settings, a teacher might say a student is “80% correct.” In Precision Teaching, the clinician would say the student is “responding at 40 words per minute.”
This distinction is critical because frequency is a more sensitive measure of behavior than percentage. It captures the ease, speed, and confidence of the learner. In this article, you will explore what precision teaching is, it role in ABA and how it differs from traditional data collection methods.
The Role of Fluency
In the Precision Training, we don’t just aim for mastery; we aim for Fluency. Fluency is the combination of accuracy plus speed. Think of it like learning to tie your shoes. You might be 100% accurate at five years old, but if it takes you ten minutes to tie one knot, you aren’t fluent. Fluency is what allows a skill to:
Be Retained: The learner remembers it after long periods without practice.
Be Durable: The learner can perform the skill even when there are distractions or high-stress environments.
Be Applied: The learner can combine small, fluent skills into more complex behaviors for example, being fluent in letter sounds makes learning easier for reading words.
How PT Differs from Traditional ABA Data
Traditional data collection in ABA often relies heavily on correct Percentage. While this is helpful for knowing if a child understands a concept, it creates a “ceiling effect.” Once a student hits 100%, the graph flatlines, suggesting there is no room left for growth. This is a myth. A student can always get better, smoother, and faster.
The Problem with Percentages
Percentages are dimensionless. They don’t tell you how long it took to get the answer.
The Hesitation Gap: A student who answers 10 math facts in 1 minute and a student who answers 10 math facts in 10 minutes both get a score of “100%.” However, the first student is ready for multiplication, while the second student is likely still counting on their fingers.
The Opportunity Trap: Percentages can hide a lack of practice. 1 out of 1 is 100%, but it doesn’t represent the same level of learning as 50 out of 50.
The Power of the Standard Celeration Chart (SCC)
Precision Teaching uses a unique tool called the Standard Celeration Chart. Unlike the linear graphs we see in most ABA software, the SCC is semi-logarithmic. It measures the rate of change (celeration). It allows clinicians to see if learning is accelerating or decelerating in a way that is mathematically consistent across all behaviors. It treats a 2x increase in speed (e.g., from 10 to 20 words per minute) as the same amount of learning as an increase from 50 to 100.
Making the Shift: Data-Driven Decisions and Instructional Effectiveness
The beauty of Precision Teaching is that it takes the guesswork out of clinical supervision. In many ABA programs, a supervisor might check a child’s progress once a week. If the child hasn’t mastered the skill, the supervisor might wait another week to see if things improve. This is “wait-to-fail” data.
Precision Teaching operates on a “Three-Day Rule.” If the data points on the SCC are not moving toward the goal for three consecutive days, the clinician must change the instruction. We don’t blame the learner; we change the teaching.
How Clinicians Can Implement PT Across Programs?
Identify Component Skills
If a learner is struggling with a complex task (the “composite”), use PT to test the smaller “component” skills. If a child can’t write a sentence, check their “big 6+6” motor skills, are they fluent in just holding a pencil or drawing a line?
Use Timed Sprints
Instead of doing 20 trials in a row, do two or three 1-minute sprints. These short bursts keep the learner engaged and provide high-density reinforcement.
Empower the Learner
One of the most humanizing aspects of PT is that learners often chart their own data. Seeing their own “dots” move up the chart provides an incredible sense of agency and pride.
Conclusion
Precision Teaching isn’t just about tracking numbers on a page; it’s really about believing in what a student is truly capable of. Instead of just checking a box because they “got the answer right,” clinicians look at how smoothly and quickly they can do it.
This focus on fluency is what makes the difference between a skill that is forgotten next week and a skill that actually works in the real world. For the people doing the teaching, it provides a clear, logical map to help them make better choices without the guesswork. And for the learners, it gives them something even better: the confidence that comes from being truly good at what they do.
Sources: